;%20}%20%3c/style%3e%3clinearGradient%20id='linear-gradient'%20x1='2.99'%20y1='29.35'%20x2='127.75'%20y2='101.39'%20gradientUnits='userSpaceOnUse'%3e%3cstop%20offset='0'%20stop-color='%23f2b347'%20/%3e%3cstop%20offset='.5'%20stop-color='%23ca5a8b'%20/%3e%3cstop%20offset='1'%20stop-color='%236654f5'%20/%3e%3c/linearGradient%3e%3c/defs%3e%3cg%20id='Layer_1-2'%20data-name='Layer%201'%3e%3cpath%20class='cls-1'%20d='M83.56,0H47.18C21.12,0,0,21.12,0,47.18v36.38c0,26.06,21.12,47.18,47.18,47.18h36.38c26.06,0,47.18-21.12,47.18-47.18V47.18C130.74,21.12,109.62,0,83.56,0ZM20.62,48.64c2.84-2.84,6.59-4.23,10.32-4.17,3.82,.07,7.55-1.1,10.25-3.8l.56-.56c2.7-2.7,3.86-6.43,3.8-10.25-.07-3.73,1.32-7.47,4.17-10.32,6.18-6.18,16.66-5.48,21.88,2.11,3.18,4.62,3.27,10.96,.19,15.64-3.02,4.6-7.92,6.78-12.72,6.54-3.51-.17-6.95,.99-9.43,3.48l-1.24,1.24c-2.48,2.48-3.65,5.92-3.48,9.43,.24,4.8-1.94,9.7-6.54,12.72-4.68,3.08-11.03,2.99-15.64-.19-7.6-5.23-8.29-15.7-2.11-21.88Zm33.7,34.25c-2.7,2.7-3.86,6.43-3.8,10.25,.07,3.73-1.32,7.47-4.17,10.32-6.18,6.18-16.66,5.48-21.88-2.11-3.18-4.62-3.27-10.96-.19-15.64,3.02-4.6,7.92-6.78,12.72-6.54,3.51,.17,6.94-.99,9.43-3.48l1.24-1.24c2.48-2.48,3.65-5.92,3.48-9.43-.24-4.8,1.94-9.7,6.54-12.72,4.68-3.08,11.03-2.99,15.64,.19,7.6,5.23,8.3,15.7,2.11,21.88-2.84,2.84-6.59,4.23-10.32,4.17-3.82-.07-7.55,1.1-10.25,3.8l-.56,.56Zm55.8-2.93c-2.96,2.96-6.91,4.35-10.79,4.15-3.51-.17-6.96,.99-9.44,3.48l-1.23,1.23c-2.49,2.49-3.65,5.93-3.48,9.44,.19,3.88-1.19,7.82-4.15,10.79-6.18,6.18-16.66,5.48-21.88-2.11-3.18-4.62-3.27-10.96-.19-15.64,3.02-4.6,7.92-6.78,12.72-6.54,3.51,.17,6.95-.99,9.43-3.48l1.24-1.24c2.48-2.48,3.65-5.92,3.48-9.43-.24-4.8,1.94-9.69,6.54-12.72,4.68-3.08,11.03-2.99,15.64,.19,7.6,5.23,8.3,15.7,2.11,21.88Z'%20/%3e%3c/g%3e%3c/svg%3e)


Enterprise DNA Skills
Business Analytics
Use data analysis and visualization techniques to inform and guide business decision-making, ultimately driving improved performance and profitability.
Start Learning for Free
New to Business Analytics?
Start here.

Paid Course
Dashboarding & Data Visualization Intensive
Learn how to develop complete Power BI solutions that look compelling and deeply engage your consumers in your insights
Learning
Paths
Path

Excel Basics: Formulas, Functions, and Formatting
Embark on this Learning Path to delve into Excel! Discover IF statements, text functions, and data cleaning, while grasping the basics of functions and formulas. Start your data analysis journey!
Beginner
7 Hours
Path

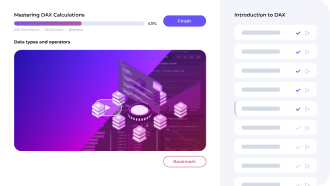
DAX Fundamentals in Power BI
This Learning Path delves into data analysis and modeling, focusing on Filter and Row Contexts for data computations, and the use of functions like SUM, SUMX, and Calculate.
Beginner
12 Hours
Path

Intermediate DAX Concepts for Power BI
This Learning Path delves into data analysis techniques, focusing on Power BI functions. It guides learners to enhance their data insight extraction skills.
Intermediate
16 Hours
Path

Advanced Visualizations and Dashboarding with Power BI
This Learning path delves into transformative data visualization techniques. Elevate your presentations, ensuring clarity and swift comprehension for your audience.
Intermediate
8 Hours
Path

Financial Analysis and Reporting in Power BI
This Learning Path delves into advanced data modeling techniques, focusing on Power BI and Enterprise DNA tools. Participants will learn to automate financial reports, utilize dynamic grouping formulas, and integrate various data sources for comprehensive analysis.
Intermediate
10 Hours
Path

Data Engineering and Dataflows in Power BI
This Learning Path delves into the transformative power of Data Engineering with Dataflows in Power BI, emphasizing centralized data management for efficient reporting. Participants will learn hands-on techniques, ensuring consistent data usage and best practices across teams.
Intermediate
2 Hours
Path

Power Platform Integration Expert
This path is designed to provide you the necessary skills to build full enterprise apps by integrating Power BI , Power Automate and Power Apps.
Intermediate
17 Hours
Path

Mastering M Code for Power Query
This Learning Path navigates learners through real-world scenarios to cultivate problem-solving skills using the M language in Power Query.
Intermediate
11 Hours
Learning
Center
Course
Dashboarding & Data Visualization Intensive
Learn how to develop complete Power BI solutions that look compelling and deeply engage your consumers in your insights
Advanced
7 Hours
Course

Machine Learning Models in Power BI
Master predictive analytics in Power BI: Learn preprocessing to advanced AutoML. Unlock powerful machine learning models and transform your data.
Intermediate
1 Hours
Course

Ultimate Beginners Guide To DAX
Explore DAX from the ground up and apply your knowledge to create impactful Power BI models. This course will guide you through the essentials of DAX, helping you to develop effective data strategies.
Beginner
3 Hours
Course

Mastering Report Development - Start to Finish
A detailed step-by-step process of creating high-quality Power BI reports that satisfy the requirements of real-world scenarios
Intermediate
3 Hours
Course

Geospatial Mastery in Power BI: Unlock Analytical Insights
Disclose the unexpected' by expertly incorporating geospatial data into your analyses and visualizations
Intermediate
1 Hours
Course

Introduction To The Analyst Hub
This module discusses the different features of the Analyst Hub platform and the tips to maximize the use of tools to enhance Power BI development.
Intermediate
1 Hours
Course

Financial Reporting With Power BI
Create comprehensive financial reports in Power BI that represent key insights in a compelling and dynamic way
Advanced
6 Hours
Course

Data Analysis with PandasAI
Unlock the power of data analysis and visualization with PandasAI, and transform raw data into actionable insights that drive decision-making and growth.
Intermediate
1 Hours
Virtual
Events
Podcast

The Role Of Geospatial Data In Logistics
Sam McKay talks to Paul Lucassen, one of our Enterprise DNA experts, about the role of geospatial data analytics in the transportation and logistics industry
Virtual Event

The Ultimate Power BI Freestyle Session
Build a comprehensive and compelling Power BI report within an hour from scratch!
01:10:29 Hours
Virtual Event

Unlocking Power BI and Excel Mastery with 0 Difficulty
Learn how simple resources can generate amazing results in the charts, applicable to any analysis.
00:59:23 Hours
Virtual Event

Power BI For Excel Users - Kick Start Your Analytics Journey
Solve advanced analytical questions using Power BI
01:02:29 Hours
Virtual Event

Supply Chain Analytics
Supply chain management involves the flow of goods and services.
01:13:18 Hours
Virtual Event

Scenario Analytics Insights
Discovering unique and valuable insights and solve advanced analytical questions using Power BI
00:57:31 Hours
Virtual Event

Solving Business Problems Through the Power Platform
Learn how to use the Dataverse, Power Apps, Power Automate in Power BI
00:51:00 Hours
Virtual Event

Clean Your Data Like A Pro
Use Power Query/ M effectively to prepare data for analysis
00:37:02 Hours
Project
Center
Challenge

Customer Insight
An opportunity to design and build a report that gives insights into customer behavior
Challenge

HR Data Insights
Challenge yourself to produce a report which gives HR insight into the consultation process.
Challenge

Purchases, Inventory And Sales
Practice your data skills and learn from what is a typical scenario faced by many businesses in various industries
Challenge

Challenge

Time Intelligence - Highlighting Trends
Showcase a report that compares the trends of two different sets of data over time. The report will specifically highlight any divergences in the trends, allowing the reader to easily see any discrepancies in the data.
Challenge

Marketing Analytics - Measuring ROI
Analyze data from marketing campaigns and initiatives, using visualization tools and statistical analysis techniques to identify trends and patterns, and use these insights to inform marketing strategy and decision-making.
Challenge

Optical Data
Provide a business solution by creating an intelligence tool to use by large opticians
Challenge

Global Cost Of Living Crisis
Identify trends and patterns in a variety of factors that influence the cost of living in different regions around the world by using statistical analysis techniques and visualization tools.