Reporting applications for a variety of business
functions, industries and scenarios
You can access ALL these Power BI solutions through Enterprise DNA's Education Platform
Compelling reports and dashboards developed in Power BI
OEE Manufacturing Report
A well-presented analysis that makes excellent use of the decomposition tree and KPI tooltips.
OEE Data Report
A beautiful and comprehensive report of important OEE metrics designed using the Numerro toolkit
Equipment Effectiveness Report
A well-organized OEE eport that uses creative visualization techniques to depict the manufacturing process
Environmental Insights Dashboard
A well-organized dashboard that uses
easy navigation features, landing pages
and side icons to show the effects of environmental issues to human health in
the past 16 years in summary statistics
Environmental Indicators Report
A well-designed and easy to navigate
report equipped with a dashboard that
provides a good summary of the
indicators and overall trends.
Environmental Report
A comprehensive illustration of a health
problem caused by environmental factors, delivered in a well-designed data story
using the Icon Map and Mapbox custom
visuals, innovative navigational elements
Environmental Data Report
An intuitive report designed with a very
user-friendly dashboard that allows
visualization of all indicators using filters
Environmental Statistics Report
A user-friendly showcase with a clean
design using filter options, illustrating
data in summary statistics
Environmental Insights
A report with great visuals, filter
options and features a variety
of graphs for analysis
Earnings Planner Dashboard
A compelling dashboard illustrating
earning drivers for strategic planning,
employing an innovative calendar
display with conditional formatting
and dynamic scenario analyses
Earnings Maximizer Showcase
A compact one-page report that
leverages custom visuals, recently
added UI features, and highly-detailed
tooltips to provide extensive analysis of
earnings and utilization
Earnings Optimizer Report
Innovative and visually striking
report, the centerpiece of which is an exceptionally detailed "what-if"
analysis that examines yearly earnings
across a variety of dimensions.
Timesheet Utilization Reporting
A detailed utilization analysis,
highlighted by an excellent navigation experience and beautifully constructed
multi-component KPI cards
Formula 1 In-Depth Insights
Super dynamic report loaded with
cohesively designed visuals using
bookmarks, tooltips, object groupings
and backgrounds, creating a superb
navigation experience
Formula 1 Dashboard
A compelling visualization created
around Formula 1 data, showing
comparisons and historical data through
well-designed visuals using bookmarks,
tooltips, grids and charts
Formula 1 Performance Analysis
Meticulously designed and planned
analysis of the performance of the
Formula 1 drivers and constructors,
built in a one-page report using
tooltips and Text Filter visuals
Emergency Services Analysis
A uniquely designed dashboard
showcasing key insights using
Charticulator and dynamic Heat Map
for visuals
Emergency Response Analytics
A well-thought report that features the
main KPIs and specific data for each
protocol of the Emergency Response Service, utilizing selected interactions, minimal
visual elements and visible page filter.
Health Services Dashboard
Simple yet seamless display of
relevant data utilizing best practices in
Power BI, formatted with JSON
theme files
Emergency Services Insights
A compelling one-page report
effectively illustrating critical insights
on the performance of emergency
services of different hospitals utilizing
detailed tools and skillful techniques
Emergency Services Analytics
A polished and clean presentation
that makes masterful use of varied
tooltips to provide extensive analytical
insights pertaining to emergency
services, within a compact report.
Health Services Analytics
A well-designed health services
analysis that effectively addresses the
data from four different perspectives
using timelines, drill-through and
hovering techniques.
Emergency Response Dashboard
A striking report design, built with an
intuitive navigation experience and a
range of creative visuals to facilitate
interactive data exploration.
Model Documentation Dashboard
Minimalist design model
documentation report that uses
combo stacked chart and displays
DAX expressions with description
Report Documentation Showcase
A well-crafted and interactive visual
depiction of report documentation,
centered on key performance metrics.
Data Documentation Dashboard
Dynamic visual overview of the
data documentation collected
through advanced scripting.
Logistics Dashboard
An eye-catching logistics dashboard
that presents relevant data using
Flow Map and drill-through techniques
Transport & Shipping Dashboard
App-inspired logistics report
revolving around profitability,
covering filters, trend and details of
revenue, cost and profit
Transport and Shipping Report
Explore the dynamic overview of
shipment profit and loss from origin
to destination countries, in relation
to time of departure and arrival in a
two- year period
Purchases Summary
Experience a compelling view
of the purchase, sales and inventory
summary that utilizes embedded
hover over tooltip and chart
annotations technique
COVID 19 Global Report
Analyze the COVID 19 global report
that compares key metrics between
regional and global levels
Purchase, Sales, Inventory Trends
A dynamic narrative summary
that utilizes Bookmarks and Selection
Pane to create a comprehensive data
story in a one-page report.
Pandemic Outbreak Report
Identify the recent COVID 19 trends
and benchmark within countries
through highlighted scatter charts
and top-notch navigation experience
COVID 19 Global Dashboard
Explore COVID 19's impact by
demographics with a special focus
on its effects by race/ethnicity in
different facets of life, using
advanced machine learning techniques.
COVID 19 Reporting
Analyze how countries dealt with
COVID-19 through visuals, narratives,
regression models, dynamic report
level tool-tips, navigations, and maps
Waste Management Profitability
Quickly determine profit, sales,
purchases, and haulage showing
different currency.
Waste Management Overview
Analyze waste management
transactions in different currencies
using snowflake model.
Currency Conversion
Showcase waste management with
clients around the globe using
progressive disclosure technique.
Supplier Risk Assessment
Assess the performance of the
External Supplier and analyze its
impact on the business
Service Desk Issues
Determine which project is
generating the most number of issues
and how many are priority to get
resolved. Monitor their status and
focus on the 'To Do's' and 'In Progress'.
Service Desk Analysis
Analyze peak periods of issues by days
and months. Allocate optimum staffing
on days/months where issues spike
to avoid backlogs.
Procurement Insights
Showcase how many days it takes for
a purchased item get to invoice
or receipt stage.
JIRA IT Service Desk
Track how fast tickets are being resolved
and how many are beyond expected
resolution period. Determine the
projects without due dates and update.
Inventory Analysis
Use many bookmarks to make a
single-page report look like a
multi-page report.
Insurance Complaints
Track the open, in progress, and
new complaints reported by your
customers. Make sure they are a
ddressed to keep them satisfied.
Sales Overview
Use four-quadrant scatter chart to
provide enormous amount of
information in a single chart.
Client Satisfaction
Monitor what category is generating
the most complaints, how long complaints
are waiting to be resolved and who's
taking days to offer solution.
Delivery Application
Select a warehouse and see all the
deliveries over a certain timeframe,
number of damaged products, returns,
and average delivery minutes per day.
Optical Data
Retain your clientele by monitoring each
of your clients' scheduled appointments
and suggesting new slot for missed
schedules.
Delivery App Review
Choose the warehouse where to source
your products by identifying each
warehouse' location and distance from
where the store is located.
Customer Engagement
Understand the correlation between
sales and customer engagement
with your email marketing strategy.
HR Interview Insight
Quickly determine your employees
satisfaction rating, the types of
consultations they've gone through
and how these relate to their performance.
Customer Insights
Compare Sales vs Engagement.
Determine how your marketing
strategy impacts your sales.
HR Consultation Insights
Evaluate how individual employees
react to each consultation and the
trends for each interviewer.
Sales Performance
Evaluate month over month sales
performance. Determine which state
or sales team performs best and the
channel that disposes product fast.
Insurance Portfolio Analysis
Analyse who your active customers are.
Evaluate which product category sells
insurance fast and the distribution
channel that works best.
Stock Market Dashboard
Dive into dynamic stock market data,
reviewing key pricing and trading
information
Call Center Insights
Review call center performance by
analysing key metrics such as
abandon rate, satisfaction score,
SLA, and average answer speed.
Inventory Analysis
Manage sales forecast versus
inventory, analyzing cash requirements
and stock replacement projections
Financial Reporting Application
Comprehensive financial reporting
application. Includes P&L, Balance
Sheet, Cash Flow reports. Dynamic
visualizations around key financial
metrics
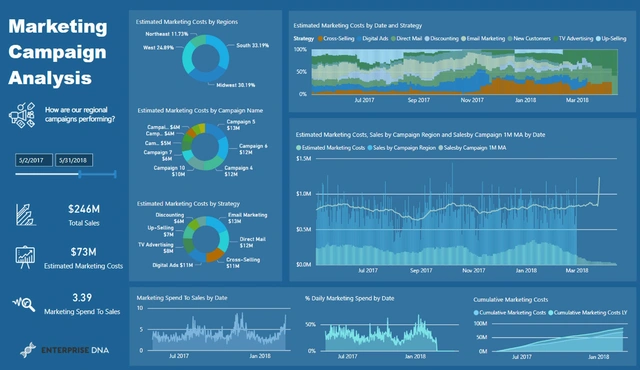
Advertising Campaigns
Gain insights into your marketing
initiatives by comparing campaign
performance over time
Accounts Receivable Reconciliation
Review historic or future cash
forecasts. Select date and dynamically
calculate the expected account receivable
with various breakdown possibilities
Regional Profit Insights
High level regional insights, includes
cross-selling analysis, scenario events,
cohort analysis encompassed within
an 'application like' development
Product Sales Overview
Evaluating product profitability for
regional business, including cluster
analysis through time, logistics insights
& advanced ranking techniques
Cohort Analysis
Advanced cohort insights for software
as a service organization. Understand
customer churn and also retention
dynamically across different regions.
Project Management Insights
Dynamic gantt chart showcasing
project management timelines and
progress. Advanced example of matrix conditional formatting in Power BI
Want to learn more how you can purchase all these solutions?
Answers to data questions for every corner of the global economy
Territory Sales Breakdown
Showcase territory analysis of
companies sales. Drill into product
insights to evaluate future revenue opportunities
Regional Summary
Segment regional data and break
down performance drivers.
Showcase dynamically attributes
driving historic results
Sales Scenario Analysis
Test outcomes of sales scenarios,
including changes in pricing and
demand of products. Review
overall performance
Country Overviews
Highlight performance divergence
across regional and country centers.
Slice information by key products and
sales groups to identify trends
Management Dashboard
Review key sales and financial metrics
in this executive dashboarding example. Dynamically drill into key dimensions
for additional insights
Insurance Applications
Evaluate performance of insurance
applications and sales process. How
effective is the organisation at receiving
and then executing on new business opportunities
Banking Clients & Risk Analysis
Total review of all banking credit risks,
for management reporting and
relationship banking dashboards. Drill
into clients by relationship, location, risk weighting and more. Identify credit risk
at the regional level and/or drill into
data at the individual client level.
Retail Store Demand
Manage all key metrics around a retail
store environment. Understand where
your most profitable stores are, and which
sales reps are the top performers.
Understand foot traffic and average
historic sales during certain parts of the
day so that you can optimise staffing
at key locations.
Consumer Goods
Sales analysis for FMCG business
selling throughout the US. Drill into
sales performance of each region or
state. Watch key sales metrics as they
happen and look for emerging trends
in the performance of products
or customers.
FX Risk Management
Keep track of all trading in financial
market products, including forward
exchange contracts and currency options. Includes ability to; monitor hedging ratios
versus set benchmarks, analyse achieved hedging rates through time and manage counter-party trading and credit risk.
Transportation Bookings
Scenario and data simulated for a
transportation company that receives
bookings from a variety of clients and
through a number of different channels including web, phone and walk ups.
Reports enable deep analysis of key
business metrics including bookings,
profits, sales, discounts and more.
Retail Sites Performance
Dynamically review key revenue and
profitability information over pre-set
time frames. Select short term or
long term time frames and have visuals automatically update. Review which
products or regions are delivering
the best performance across
retail sites network.
Insurance Applications
Measure insurance applications across
sales and branch networks, real time
updates on application assessment times
and product popularity, measure premiums versus insurance coverage ratios and
evaluate key customers and risk
assessments at a group or individual level.
Professional Services
Review time spent on specific
engagements and project with clients.
Which business units are utilising services
more than others. Evaluate professional
service utilisation rates through time.
Review return on time or effort versus
value added per project
Just starting out with Power BI? Check out this free training.
Discover the possibilities throughout your organisation
Financial Reporting Templates
Create comprehensive and detailed
financial reporting tables inside Power BI
using custom templating technique
Quarterly Business Insights
Showcase valuable business insights
across fiscal quarters of all important organizational metrics
Financial Reporting
Report on detailed Profit & Loss data
with Power BI. Compare results over
different time periods and versus
budgets
Advanced Budgeting
Compare actual results to budgets.
Distribute budgets across year according
to seasonality within data. Complex
analytical techniques
Inventory Management
Deep dive into key performance metrics
for stock and inventory control. Manage
stock levels within warehouse assets to
current sales and future predicted sales
Employee Insights
Summary human capital insights for
large corporate business. Analyse trends
and breakdown of employee make-up.
Simple and effective dashboarding
techniques
Sales Budgeting
Collect and manage organisation
wide customer sales budgets. Gain
insight into where your future revenue
will derive from. Who are your key clients?
Who are they internally managed by?
Where do you need to allocate resources
both tactically and spatially to make
sure each clients get the correct
coverage for maximum impact.
CRM Sales Data
Detailed analysis on customer
relationship management (CRM)
sales data. Understand where your sales
have derived from, where the next
opportunities are and be on top of the probabilities and financial implications
of successful future sales pursuits.
Financial Analytics
Real time financial analytics for
asia-pacific focused corporate. See
key financial results including total;
sales, cost, profits and more.
Drill into key products and clients.
Identify emerging trends, explore
future sales opportunities and monitor
key stock levels. Compare across
territories and through time.
Global Finance Function
Finance function within global food
distribution organisation analysing key
metrics for entire financial year. Ability to
access greater analysis across regions and through time. Gain insights in sales performance per products and product categories.
Human Capital Analytics
Gain a full overview of all your employee
metrics and movements in real time. Human capital strategy relies on advanced analysis
for effective decision making. Not only do
you need to run analysis on historical information but also simulate future changes, and the flow on impacts these may have
on organisational profitability or well-being.
Website Analytics
Analyze key attributes of website and
constantly review engagement of visitors
and subscribers. Review by region, traffic source, device, age segment and more.
Review entry and exit points of website
and make changes based on actual raw
website data.
Manufacturing Operations
Monitor your manufacturing operations
with detailed reporting and dashboards
of key metrics from the factory floor to
your sales teams. Review daily your new invoicing versus your products being
produced. Understand your production
cycle and where operational hold ups
are occurring. Review factory output
and current live orderbank across a
range of production centers.
Inventory Management
Monitor inventory levels across
warehouses versus trends for revenue
across sales channels. Review short-term
cash requirements for upcoming stock
re-order programs. Analyse key vendors
and look for procurement discounting
opportunities. Review real time stock-take analysis and evaluate value of inventory
sitting on warehouse floors.
Want to purchase these showcases?
Automate insights for complex enterprise scenarios
Detecting Outliers
Detect outliers or anomalies
within your data. Showcase trends
and change over time for
this abnormal results
Executive Insights
Dive into key performance metrics
that showcase results in a simple and
intuitive way. Review results via a
top-down approach
Regional Performance
Compare performance across regional
sectors. Identifying near term trends
and filter information by numerous
attributes within datasets
Product Discounting Scenarios
Run unlimited 'what if' scenarios for
product discounting strategies. Measure effectiveness of discounting to follow up demand. Track key overall performance indicators
Regional Performance
Dynamic visualisation technique
to effectively showcase the regional
performance of store sales and
profitability
Understanding Your Customers
Deep dive into customer revenue
and profitability information. Identify
where you are making sales and when
via which products or services. Drill
into specific customers or groups
of customers. Review performance
through time of various important
client metrics.
Client Insight
Learn everything you need to know
on your customer data. Understand
which sales are occurring in which sales
regions. Analyse trends over time, how
customer sales are tracking versus last year
and customer profitability. Compare
results versus individual customers
and within regions.
Time Intelligence
Review key metrics through time,
comparing current actuals to same
period last year. Analyse total;
sales, costs and profits. Identify trends as
they emerge, and develop conversation
about key profitability drivers within
a sales organisation. Evaluate product performance regional and per client.
By having an Enterprise DNA Membership, you will gain access to our education platform. Access to our Power BI models, detailed training videos, resources & on-going support for continuous learning of Power BI users of all levels.