;%20}%20%3c/style%3e%3clinearGradient%20id='linear-gradient'%20x1='2.99'%20y1='29.35'%20x2='127.75'%20y2='101.39'%20gradientUnits='userSpaceOnUse'%3e%3cstop%20offset='0'%20stop-color='%23f2b347'%20/%3e%3cstop%20offset='.5'%20stop-color='%23ca5a8b'%20/%3e%3cstop%20offset='1'%20stop-color='%236654f5'%20/%3e%3c/linearGradient%3e%3c/defs%3e%3cg%20id='Layer_1-2'%20data-name='Layer%201'%3e%3cpath%20class='cls-1'%20d='M83.56,0H47.18C21.12,0,0,21.12,0,47.18v36.38c0,26.06,21.12,47.18,47.18,47.18h36.38c26.06,0,47.18-21.12,47.18-47.18V47.18C130.74,21.12,109.62,0,83.56,0ZM20.62,48.64c2.84-2.84,6.59-4.23,10.32-4.17,3.82,.07,7.55-1.1,10.25-3.8l.56-.56c2.7-2.7,3.86-6.43,3.8-10.25-.07-3.73,1.32-7.47,4.17-10.32,6.18-6.18,16.66-5.48,21.88,2.11,3.18,4.62,3.27,10.96,.19,15.64-3.02,4.6-7.92,6.78-12.72,6.54-3.51-.17-6.95,.99-9.43,3.48l-1.24,1.24c-2.48,2.48-3.65,5.92-3.48,9.43,.24,4.8-1.94,9.7-6.54,12.72-4.68,3.08-11.03,2.99-15.64-.19-7.6-5.23-8.29-15.7-2.11-21.88Zm33.7,34.25c-2.7,2.7-3.86,6.43-3.8,10.25,.07,3.73-1.32,7.47-4.17,10.32-6.18,6.18-16.66,5.48-21.88-2.11-3.18-4.62-3.27-10.96-.19-15.64,3.02-4.6,7.92-6.78,12.72-6.54,3.51,.17,6.94-.99,9.43-3.48l1.24-1.24c2.48-2.48,3.65-5.92,3.48-9.43-.24-4.8,1.94-9.7,6.54-12.72,4.68-3.08,11.03-2.99,15.64,.19,7.6,5.23,8.3,15.7,2.11,21.88-2.84,2.84-6.59,4.23-10.32,4.17-3.82-.07-7.55,1.1-10.25,3.8l-.56,.56Zm55.8-2.93c-2.96,2.96-6.91,4.35-10.79,4.15-3.51-.17-6.96,.99-9.44,3.48l-1.23,1.23c-2.49,2.49-3.65,5.93-3.48,9.44,.19,3.88-1.19,7.82-4.15,10.79-6.18,6.18-16.66,5.48-21.88-2.11-3.18-4.62-3.27-10.96-.19-15.64,3.02-4.6,7.92-6.78,12.72-6.54,3.51,.17,6.95-.99,9.43-3.48l1.24-1.24c2.48-2.48,3.65-5.92,3.48-9.43-.24-4.8,1.94-9.69,6.54-12.72,4.68-3.08,11.03-2.99,15.64,.19,7.6,5.23,8.3,15.7,2.11,21.88Z'%20/%3e%3c/g%3e%3c/svg%3e)


Enterprise DNA Skills
Data Visualization
Present complex data in a clear and concise visual format, helping to identify patterns and trends that may not be immediately apparent in raw data.
Start Learning for Free
New to Data Visualization?
Start here.

Free Course
Beginners Guide to Power BI
Kickstart your journey with our specialized training! Turn raw data into stunning visuals and master Power BI essentials through interactive lessons. Begin your path to data expertise!
Learning
Paths
Path

Data Analytics Generalist
Become a Data Analytics Generalist! Master diverse skills beyond exam prep, forging a robust foundation for success in any data analysis role. Gain a versatile skill set covering a wide range of data analysis techniques and tools, preparing you for diverse roles in the dynamic field of data analytics!
Beginner
14 Hours
Path

Power BI Data Analyst
Unlock your potential as a Power BI Data Analyst! Master the skills needed to ace the PL-300 certification exam, blending foundational Power BI knowledge with advanced DAX techniques. Get ready to excel in the world of data analytics!
Beginner
10 Hours
Path

Financial Analysis and Reporting in Power BI
Dive into Advanced Financial Analysis! Explore advanced data modeling techniques in Power BI and Enterprise DNA tools, mastering dynamic grouping formulas and automated financial reporting for comprehensive analysis.
Intermediate
10 Hours
Path

Advanced Visualizations and Dashboarding with Power BI
Unleash Visual Brilliance! Master transformative techniques for captivating presentations, ensuring clarity and swift comprehension for your audience. Optimize dashboard performance and scalability through efficient data modeling techniques and optimization strategies
Intermediate
8 Hours
Path

Advanced DAX for Power BI
Power Up Your Visualizations! Gain mastery in Power BI and DAX, enhancing your data analysis techniques and visualization skills for impactful insights. Gain expert-level skills in data analysis and dynamic visualization, setting you apart as a data analysis powerhouse.
Intermediate
5 Hours
Path

Power BI Advanced Analytics Expert
Ignite Advanced Insights! Explore Power BI's advanced analytics features, integrating R and Python to unlock actionable insights and drive business success. Master the advanced analytics capabilities of Power BI and elevate your data expertise to expert levels.
Intermediate
10 Hours
Path

Power Platform Integration Expert
Unlock the potential of Power Platform integration! Master the art of building enterprise apps by seamlessly integrating Power BI, Power Automate, and Power Apps. Gain the skills you need to drive innovation and efficiency in your organization's data ecosystem.
Intermediate
17 Hours
Path

DAX for Power BI Analysis
Dive into DAX Mastery! Master the most in-depth and rigorous path on Power BI, gaining expert-level skills across all key pillars of analysis. Gain the edge you need to excel in Power BI and drive impactful insights.
Intermediate
20 Hours
Learning
Center
Course
Beginners Guide to Power BI
Kickstart your journey with our specialized training! Turn raw data into stunning visuals and master Power BI essentials through interactive lessons. Begin your path to data expertise!
Beginner
2 Hours
Course

Data Literacy for Beginners
Step into data mastery: Discover the essentials of data literacy! Learn to make confident decisions and navigate the world of data with ease.
Beginner
1 Hours
Course

Geospatial Mastery in Power BI: Unlock Analytical Insights
Disclose the unexpected' by expertly incorporating geospatial data into your analyses and visualizations
Intermediate
1 Hours
Course

Introduction to ChatGPT's Advanced Data Analysis (ADA)
Unlock data insights with ADA. Elevate your analysis skills using ChatGPT's advanced algorithms and transform your data interpretation.
Beginner
2 Hours
Course

Foundations of Data Analytics
Dive deep into Data Analytics! Gain a profound understanding of the practicality and significance of data-driven insights in today's decision-making landscape
Beginner
2 Hours
Course

Mastering Paginated Reports: Diverse Report Creation
Master report creation in Paginated Report Builder and unleash your data storytelling skills. Learn to craft diverse report types with precision and impact!
Intermediate
3 Hours
Course

Excel to Python for Data Analysis
Transform your data approach with Python expertise! Transition from Excel and open the door to limitless possibilities for your projects, seamlessly moving from cells to scripts.
Beginner
1 Hours
Course

Data Analysis with PandasAI
Unlock the power of data analysis and visualization with PandasAI, and transform raw data into actionable insights that drive decision-making and growth.
Intermediate
1 Hours
Virtual
Events
Podcast

The Role Of Geospatial Data In Logistics
Sam McKay talks to Paul Lucassen, one of our Enterprise DNA experts, about the role of geospatial data analytics in the transportation and logistics industry
Virtual Event

Environmental Data Storytelling Maps, Infographics & More
Learn how to create your own interactive infographics, and combine your data with images, icons and animations to bring it to life
01:00:48 Hours
Virtual Event

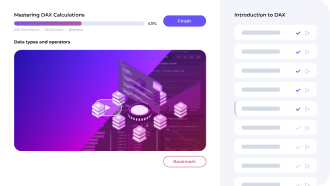
Power BI Accelerator - April 2023
Create advanced analytical models by learning how to harness the power of DAX calculations for use within Power BI
08:16:20 Hours
Virtual Event

Dashboard Makeover Session
Review a number of techniques specifically around dashboarding in Power BI.
00:52:16 Hours
Virtual Event

Creating Advanced Maps in Power BI with Icon Map
Learn how to add images to your maps, draw lines and create choropleth maps
00:39:19 Hours
Virtual Event

Financial Reporting in Power BI
Focus on financial reporting techniques in Power BI. We will be building a PnL statement from scratch, utilizing all the key features of Power BI.
01:32:06 Hours
Virtual Event

9 1/2 Tips for Awesome Visualisations in Power BI
Stop wasting your valuable time in building or deciphering confusing visualizations and increase your insight
00:43:25 Hours
Virtual Event

Better Insights from Visually Consistent Dashboards
Find out why pattern recognition results in faster and better understanding
00:33:31 Hours
Project
Center
Challenge

Demo Challenge 7 - Financial Reporting
Create your most impressive financial report that showcases valuable insight into Power BI
Challenge

OEE Manufacturing Report
Work on one of the most significant measures for manufacturing productivity - OEE
Challenge

Marketing Analytics - Measuring ROI
Analyze data from marketing campaigns and initiatives, using visualization tools and statistical analysis techniques to identify trends and patterns, and use these insights to inform marketing strategy and decision-making.
Challenge

Insurance Complaints
Analyze the data of a large insurance company who are due to undergo an internal audit with regard to its complaint’s procedure
Challenge

Call Center Data Reporting
Create a report summary of the overall services provided by a Call Centre for its management
Challenge

Delivery App Review
Create a report or dashboard to help management visualize what is happening on the new app
Challenge

Sales and Production Analysis
Implement your analytical skills in creating a report of the entire business operation from production to forecasting.
Challenge

EDNA Youtube Channel Data Analysis
Analyze Enterprise DNA's Youtube Channel Data to understand its audience and create a strategy to drive more channel engagement.
Guides
Resource

Deneb Cheat Sheet
A “cheat sheet” can be useful. We hereby present a “cheat sheet” for Deneb and Vega-Lite that contains several small sections with context and code snippets